Platform Engineering: The Business Case Every CTO Must Make in 2026
Published
Platform Engineering: The Business Case Every CTO Must Make in 2026
Platform engineering has a quantified return on investment, and it’s no longer a research estimate. Forrester Research (2024) commissioned a Total Economic Impact study on the Cortex Internal Developer Platform and found 224% ROI, $4.41M net present value over three years, and payback in six months. These numbers come from real enterprise deployments.
This is Part 2 of a three-part series. Part 1: The Executive Guide covered what platform engineering is and how it differs from DevOps. Here we build the board-level business case: PESTEL forces, ROI evidence, attrition math, and how platform maturity affects M&A valuation. For the implementation roadmap, Part 3: Technology Deep Dive maps the toolchain and reference architectures.
Key Takeaways
- Forrester found 224% ROI, $4.41M NPV over three years, and six-month payback on Internal Developer Platform investment (Forrester Research, 2024)
- Developers spend only 16% of their time writing code — the rest is friction that platforms can eliminate (IDC/Atlassian DevEx, 2024)
- Developer replacement costs 150-200% of annual salary; McKinsey found top-quartile DevEx organizations have 47% higher retention (Gallup, 2024; McKinsey Digital, 2024)
- FinOps Foundation estimates 27-35% of cloud spend is wasted without platform guardrails (FinOps Foundation, 2024)
- Mandating platform use without developer buy-in reduces throughput by 8% — adoption must be voluntary (DORA, 2024)
What Is Driving Platform Engineering Investment Right Now?
The Internal Developer Platform market is valued at $2.04B and growing at 21.9% CAGR (Technavio, 2024). That growth rate reflects organizations that have measured their developer friction and are paying real money to eliminate it. Gartner (2024) predicts 80% of engineering organizations will have platform teams by 2026 — a timeline that makes this a 2026 budget decision, not a future-state aspiration.
Six forces are converging to make that investment inevitable.
| Factor | Business Implication |
|---|---|
| Political | US Executive Order 14028 on software supply chain security requires federal contractors to demonstrate controlled, auditable delivery pipelines. Platform engineering’s standardized CI/CD and policy-enforced golden paths are the structural mechanism for compliance. Organizations in the federal supply chain face direct procurement pressure. |
| Economic | IDC and Atlassian (2024) found developers spend only 16% of their time writing code. At an average fully-loaded cost of $180,000 per developer, the other 84% represents an optimization target worth pricing explicitly before every budget cycle. |
| Social | Engineering talent expects modern tooling. McKinsey Digital (2024) found top-quartile developer experience organizations have 47% higher retention. In a market where developer replacement costs 150-200% of annual salary (Gallup, 2024), the toolchain you provide is a retention lever. |
| Technological | Cloud-native architectures distribute infrastructure ownership across every team, compounding complexity as headcount grows. Platform engineering centralizes that complexity without slowing teams down. DORA 2024 shows elite performers deploy 182 times more frequently than low performers — the structural difference is platform maturity. |
| Environmental | Platform-enforced resource tagging, auto-scaling policies, and environment lifecycle management reduce cloud waste. FinOps Foundation (2024) estimates 27-35% of enterprise cloud spend is wasted. Platforms are the mechanism to recover it, with direct implications for sustainability reporting. |
| Legal | SOC 2 Type II, ISO 27001, and GDPR Article 32 all require controlled access, audit logging, and change management evidence. Platform golden paths encode these controls by default. Every deployment through the platform generates an audit artifact automatically, reducing compliance overhead and audit scope. |
What Does Platform Engineering Actually Return on Investment?
The 224% ROI figure from Forrester Research (2024) is the headline, but the six-month payback period is the number that wins budget conversations. It’s shorter than most software procurement cycles. When you frame this as a same-fiscal-year return, the CFO conversation changes fundamentally.
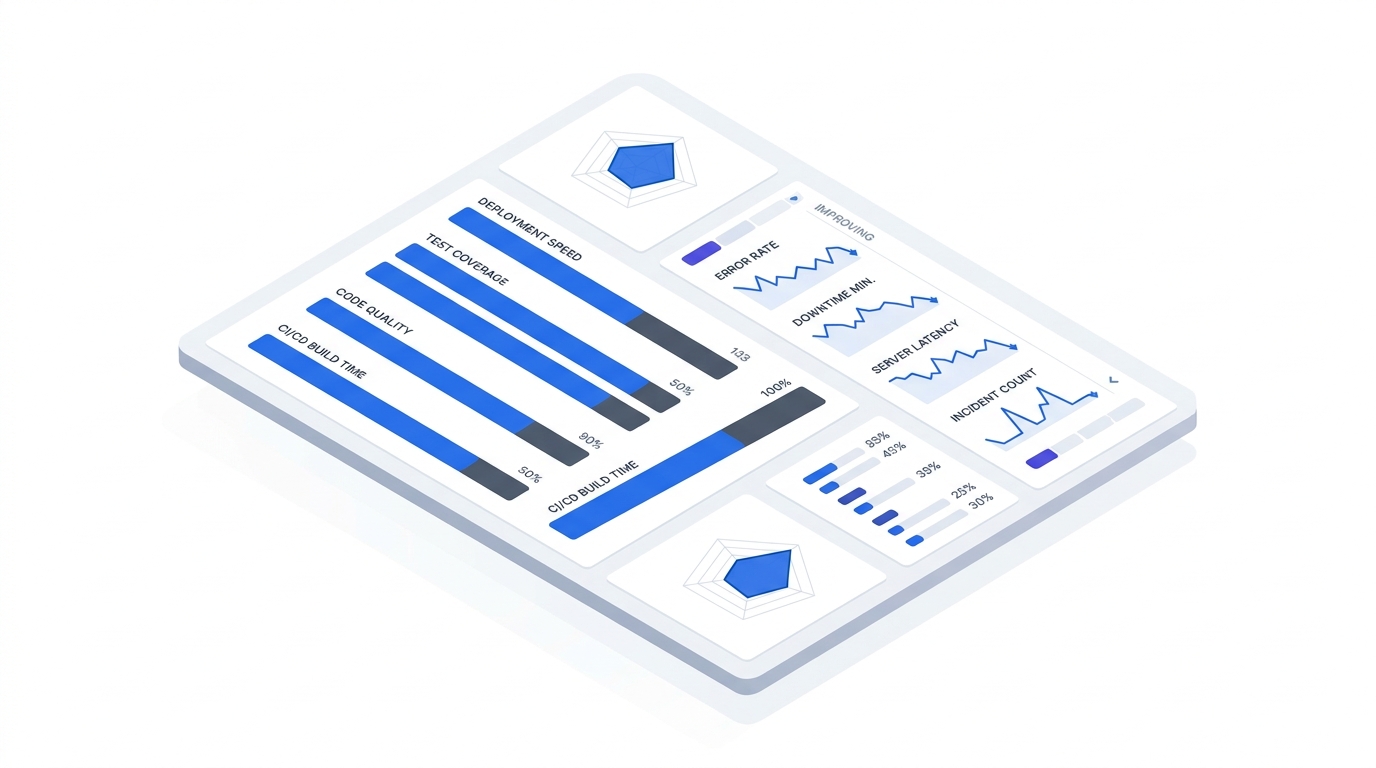
The ROI breaks down across four measurable buckets. Productivity recovery: IDC/Atlassian (2024) values recovered developer capacity at $12,500 per developer per year. On a 100-developer team, that’s $1.25M annually before any attrition savings or cloud cost reduction. Deployment throughput: Snowflake and Pulumi’s case study found an 85% reduction in deployment time after platform adoption. Developer satisfaction scores: platforms that reduce toolchain friction move satisfaction scores meaningfully, which connects directly to retention economics.
The $4.41M NPV over three years in the Forrester study includes the investment phase, not just the returns. It’s a net figure. That matters when presenting to a CFO who will ask about total cost of ownership.
How Does Developer Attrition Factor Into the Business Case?
Replacing a developer costs 150-200% of their annual salary, according to Gallup (2024). At a market salary of $150,000 for a senior engineer, each departure costs $225,000 to $300,000 in recruiting fees, interviewer time, onboarding, and productivity loss during the ramp period. Platform engineering reduces the friction that drives attrition — and the math is worth running explicitly.
McKinsey Digital (2024) found that organizations in the top quartile for developer experience have 47% higher retention than those in the bottom quartile. For a 100-person engineering team with a 15% annual attrition rate, that translates to fifteen departures per year. A 47% reduction brings that to roughly eight. At $262,500 average replacement cost, the annual saving is approximately $1.84M — from attrition reduction alone, before counting any productivity gains.
The developer satisfaction data supports this. IDC/Atlassian (2024) found 97% of developers say they lose significant time to friction. Developers who are constantly context-switching between broken toolchains are both less productive and more likely to leave. Platform engineering addresses both outcomes with the same investment.
What Is the SWOT of a Platform Engineering Investment?
Platform engineering delivers 224% ROI and $4.41M NPV over three years per Forrester Research (2024), but 8% of programs produce negative returns when adoption is mandated rather than earned (DORA, 2024). This SWOT surfaces both the quantified upside and the failure modes that separate programs that reach that return from those that don’t.
Platform engineering is a compelling investment with real implementation risk. This table is built to give CFOs and CTOs an honest picture — the weaknesses and threats are where programs fail, and surfacing them early leads to better outcomes.
| Dimension | Detail |
|---|---|
| Strengths | Quantified 224% ROI and six-month payback (Forrester, 2024). Addresses developer attrition at 150-200% replacement cost (Gallup, 2024). Recovers $12,500 per developer per year in productive capacity (IDC/Atlassian, 2024). Reduces cloud waste by 27-35% through enforced guardrails (FinOps Foundation, 2024). Generates compliance audit artifacts automatically. |
| Weaknesses | Initial platform team investment (typically 4-8 engineers) before any return materializes. Risk of building a technically impressive platform that developers work around rather than through. High organizational change management burden — platform adoption must be earned, not mandated. Skills to run a platform team are scarce and expensive in the current market. |
| Opportunities | FinOps savings of 27-35% on cloud spend create a near-term payback narrative independent of developer productivity. Elite DORA performance — 182x more frequent deployments, 2,293x faster incident recovery (DORA, 2024) — is a competitive differentiation story. Platform maturity increasingly influences M&A technical due diligence and acquisition premiums. IDP market at 21.9% CAGR means vendor tooling is maturing rapidly, reducing build cost. |
| Threats | Mandatory adoption without developer buy-in reduces throughput by 8% (DORA, 2024) — coercion backfires. Platform team fragmentation if leadership treats it as an ops ticket queue rather than a product team. Executive sponsorship loss mid-programme when early metrics are not visible. Vendor consolidation risk if a key IDP vendor exits or pivots. |
What Does the ROI Maturity Curve Look Like Year by Year?
Forrester’s TEI study (2024) maps a clear trajectory: initial investment of roughly $800K, break-even at six months, $1.1M NPV at year one, $2.4M at year two, and $4.41M cumulative NPV at year three — a 224% return. Understanding this curve is essential for structuring the multi-year budget conversation with accuracy.
Platform engineering doesn’t pay back linearly. The investment is front-loaded, and the returns accelerate. Forrester’s TEI study (2024) maps a clear trajectory: six-month payback, then compounding returns as adoption deepens.
Understanding this curve matters for how you stage the budget conversation. Year-zero cost is real: platform team headcount, tooling licenses, and the opportunity cost of engineers not shipping product features. The six-month payback timeline means that cost does not compound into year two. By the time you’re renewing the platform team’s headcount budget, the program is already net positive.
How Does FinOps Connect to Platform Engineering?
The FinOps Foundation (2024) estimates that 27-35% of enterprise cloud spend is wasted due to poor governance and the absence of guardrails. On a $10M annual cloud bill, that’s $2.7M to $3.5M in preventable waste. Platform engineering is the organizational mechanism to recover it — and the FinOps angle often provides a faster payback story than the productivity narrative alone.
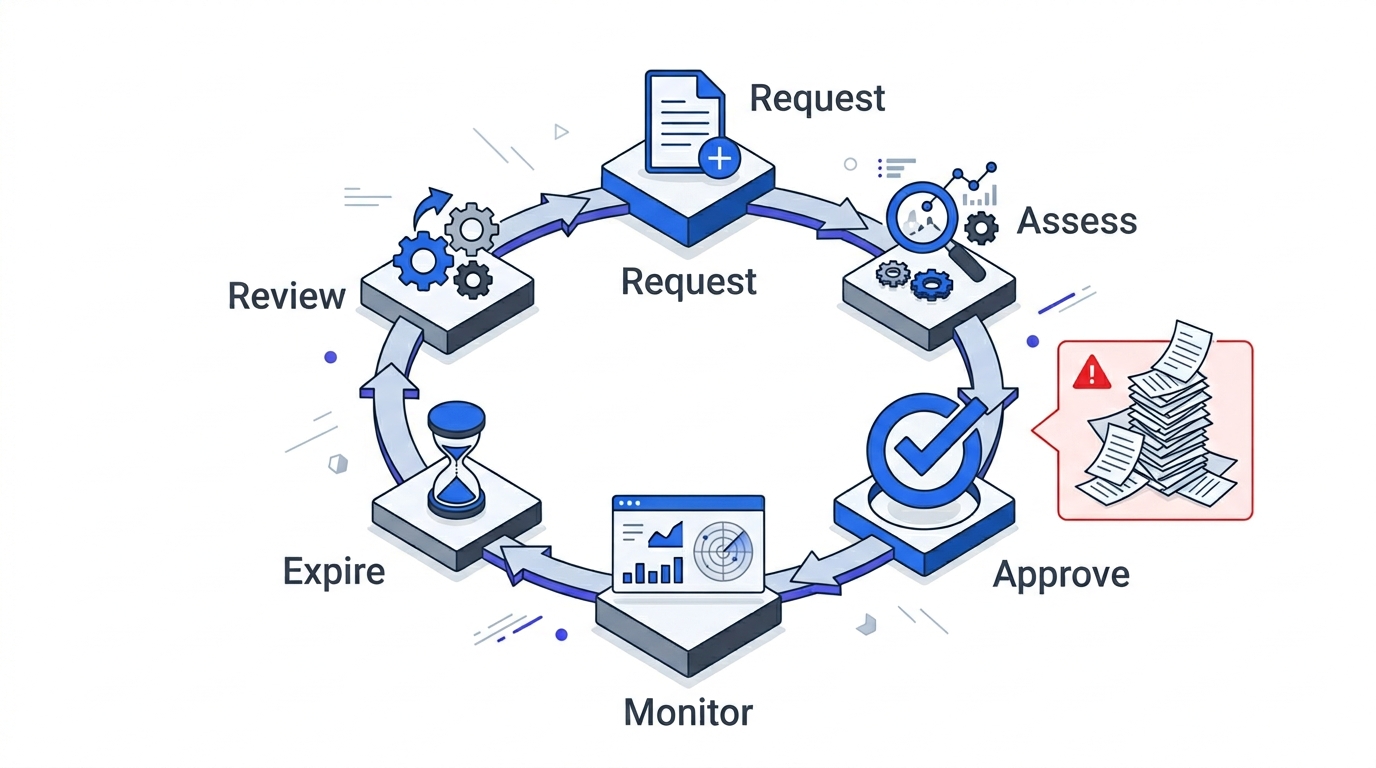
The mechanism is straightforward. Without a platform, every team provisions resources differently. Orphaned environments accumulate. Staging databases run over weekends. Development clusters scale up and never scale down. No single team owns the waste because no single team can see it. Platform guardrails change this. Mandatory resource tagging, automated environment lifecycle policies, and quota enforcement built into the golden paths eliminate the conditions that create waste.
The Snowflake and Pulumi case study found an 85% reduction in deployment time after platform adoption. Faster deployments also mean shorter-lived environments: resources spin up for a deployment, then terminate. That lifecycle discipline is a cloud cost multiplier that compounds across every team using the platform.
This creates a secondary business case that finance teams understand immediately. Cloud cost reduction has a clear owner (the cloud budget), a clear baseline (last year’s bill), and a measurable delta. If your primary ROI narrative around developer productivity feels abstract to a CFO, the FinOps angle is concrete and auditable. Use both.
Does Platform Engineering Maturity Affect M&A Valuation?
Elite performers deploy 182 times more frequently and recover from failures 2,293 times faster than low performers, per DORA 2024. Acquirers using DORA benchmarks in technical due diligence can precisely quantify delivery capability gaps — which means platform maturity is now a direct input to acquisition pricing and post-close integration cost estimates.
This is the question most engineering leaders haven’t thought to ask — and it’s where platform engineering has its most underappreciated financial impact. Platform maturity is increasingly part of technical due diligence in M&A processes. Acquirers assessing a software business now examine delivery capability directly: how often does the target deploy, how long does it take to onboard a new engineer, and how much technical debt is hidden in the toolchain?
DORA 2024 gives buyers a precise benchmark. Elite performers deploy 182 times more frequently and recover from failures 2,293 times faster than low performers. A target company in the low-performer band carries a hidden integration cost: the acquiring team will spend months or years normalizing the delivery capability before it can scale. That integration risk shows up in valuation as a discount or as post-close remediation escrow.
The converse is also true. A company with demonstrable elite DORA performance and a mature internal developer platform represents lower integration risk, faster time-to-value post-acquisition, and a delivery infrastructure the acquirer can extend to other portfolio companies. That is a valuation premium argument, not just a risk-reduction argument.
Gartner (2024) predicts 80% of engineering organizations will have platform teams by 2026. For organizations on a three-to-five year exit horizon, that benchmark matters. Being in the 20% without a platform team at the time of due diligence is a negotiating disadvantage. Starting now preserves optionality.
Why Does Mandating Platform Adoption Kill Returns?
DORA’s 2024 research found that mandating platform use without developer buy-in produces an 8% reduction in throughput — flipping the ROI sign from positive to negative. This finding appears in 224% ROI programs and zero-return programs alike; adoption strategy, not technology selection, is the differentiating variable.
One finding in DORA’s 2024 research deserves explicit attention in every platform business case: organizations that mandated platform use without developer buy-in saw an 8% reduction in throughput. Not a flat return. A negative one. The platform investment delivered the wrong sign on the ROI calculation.
This happens for a predictable reason. Developers required to use a platform they don’t trust, or don’t understand, build workarounds. They route around the golden paths, maintain their own scripts alongside the official tooling, and spend additional time managing the conflict between the platform and their existing workflow. The net result is more complexity, not less.
The implication for the business case is practical. Adoption strategy belongs in the budget presentation alongside the technical architecture. A platform team that treats developer adoption as a product challenge — user research, feedback loops, opt-in golden paths, visible wins — will reach the Forrester return profile. A platform team that treats adoption as an IT rollout will not.
This is also where the IDC/Atlassian (2024) data connects. If 97% of developers say they lose significant time to friction, there is genuine demand for a better experience. The platform team’s job is to build something developers actually want to use — then the adoption takes care of itself. When that happens, the 182x deployment frequency elite performers achieve becomes an achievable target rather than a benchmark on a slide.
Frequently Asked Questions
How do I build a platform engineering business case for my CFO?
Start with three numbers your finance team already tracks: engineering headcount cost, cloud spend, and attrition rate. Price the productivity recovery at $12,500 per developer per year (IDC/Atlassian, 2024), the cloud waste reduction at 27-35% of your cloud bill (FinOps Foundation, 2024), and attrition reduction at 150-200% of salary per avoided departure (Gallup, 2024). Add them up before you introduce the Forrester TEI numbers.
How long before a platform team delivers measurable ROI?
Forrester’s TEI study (Forrester Research, 2024) found a six-month payback period on a well-scoped IDP investment. Practical experience suggests that cloud cost reduction and deployment frequency improvements are visible within the first quarter of platform adoption. Developer satisfaction score improvement and attrition reduction are typically measurable within six to twelve months.
What is the minimum viable platform team size?
Most practitioners recommend four to six engineers for an initial platform team serving 20-100 developers. Below four, the team cannot maintain the platform while also building new capabilities. The platform team should be staffed as a product team: an engineering lead, two to three platform engineers, and at least one person accountable for developer experience and adoption.
Is it better to build or buy an Internal Developer Platform?
Neither answer is universal. Build gives you full control and no vendor lock-in, but front-loads engineering cost significantly. Buy with tools like Cortex, Port, or OpsLevel reduces build time but introduces licensing cost and feature constraints. Most organizations start with an open-source developer portal like Backstage and buy specific capabilities (secret management, cost visibility) as SaaS components. The Part 3: Technology Deep Dive covers the build-vs-buy framework in detail.
Why does mandatory platform adoption reduce throughput?
DORA 2024 measured an 8% throughput reduction when platform use was mandated without developer buy-in. Developers who distrust a platform build workarounds that add complexity rather than removing it. Successful platform programs treat adoption as a product problem: make the golden paths genuinely faster than the alternatives, and adoption follows without coercion. The platform should win on merit.
How does platform engineering reduce cloud waste?
FinOps Foundation (2024) estimates 27-35% of enterprise cloud spend is wasted due to absent guardrails and inconsistent governance. Platform engineering enforces resource tagging, automated environment lifecycle policies, and quota controls uniformly across all teams. On a $10M cloud bill, that discipline recovers $2.7M to $3.5M annually — often the fastest-to-close line item in the business case.
What is the developer attrition cost that platform engineering prevents?
Replacing a developer costs 150-200% of annual salary, per Gallup (2024). A 100-engineer team at 15% annual attrition with a $150K average salary faces roughly $3.4M in annual replacement costs. McKinsey Digital (2024) found top-quartile developer experience organizations have 47% higher retention — which translates to approximately $1.84M in avoided attrition costs annually.
How does platform engineering support compliance and audit readiness?
Platform golden paths encode SOC 2 Type II, ISO 27001, and GDPR Article 32 controls by default — every deployment generates an audit artifact automatically. Organizations no longer need to reconstruct change history from disconnected systems during audits. This reduces compliance overhead significantly and narrows audit scope, converting a recurring manual cost into a platform-enforced default at no additional marginal cost per deployment.
Conclusion
The business case for platform engineering is no longer theoretical. A 224% ROI, $4.41M NPV, and six-month payback from Forrester’s TEI study, combined with the attrition math from Gallup and McKinsey, the cloud waste data from FinOps Foundation, and the DORA performance benchmarks, produce a case that holds up under CFO scrutiny.
The six-month payback is the strategic asset in that evidence base. It means this is a same-year return on a current-year budget line. It means the risk of inaction is measurable: every quarter without a platform is a quarter of $12,500 per developer in recoverable capacity that doesn’t get recovered, cloud waste that doesn’t get eliminated, and attrition costs that don’t get avoided.
The DORA nuance is equally important. The 224% ROI is available — but only to organizations that earn developer adoption rather than mandate it. That constraint shapes how you staff the platform team, how you sequence the rollout, and how you measure success in the first year.
The 80% adoption rate Gartner predicts for 2026 means this is the new baseline, not a competitive advantage. The competitive advantage belongs to the organizations that get there first and build delivery capability that compounds over time.
Return to Part 1: The Executive Guide for the foundational concepts, or continue to Part 3: Technology Deep Dive for the implementation stack, reference architectures, and how to evaluate Backstage and its commercial alternatives. Note that platform golden paths are one of the most effective mechanisms for enforcing Zero Trust Architecture policies at scale — every workload deployed through the platform inherits the security baseline automatically.