Zero Trust Baseline Metrics: Your 'Before' Snapshot
Published
You can’t demonstrate progress without a starting point. The metrics you capture before Day 1—your baseline—become your argument for continued investment at Day 30, 60, and 90. They’re the data that justifies the next phase of work. They’re also the foundation for the board presentation at Day 90, where you’ll show how far you’ve moved the needle and why the investment paid off.
Without a baseline, progress is a story. With one, it’s a fact.
The Core Metrics to Capture
Before your Zero Trust initiative kicks off, lock in these seven measurements. They’re the ones that matter most to executives, security teams, and audit stakeholders.
1. CISA Maturity Per Pillar
The CISA Zero Trust Maturity Model v2.0 assesses your security posture across five pillars, each with four maturity levels:
- Traditional → Initial → Advanced → Optimal
Capture a baseline score for each pillar:
- Identity: How centrally controlled is user access?
- Devices: How many devices are unmanaged or running outdated OS?
- Networks: What percentage of your network is segmented?
- Applications & Workloads: How many apps require explicit authentication and encryption?
- Data: How many databases are behind encryption and access controls?
Self-assess honestly. If your Identity pillar is “Traditional,” that’s the baseline you measure against in 90 days.
2. MTTD: Mean Time to Detect
How long does it take from breach to discovery? The industry average is 158 days (IBM Cost of a Data Breach 2025). Top performers detect within 60 minutes.
Your baseline answer: “We’d know in ___ days” or “We’d never know until forensics.” Both are valid. Both are fixable.
3. MTTC: Mean Time to Contain
Once you know there’s a breach, how long to stop lateral movement? Mature Zero Trust architectures reduce this from days to hours by limiting what a compromised workstation can reach.
Baseline: “We can isolate a segment in ___ minutes” or “We’d need to pull the plug.”
4. MFA Adoption %
What percentage of human users have multi-factor authentication enabled? This is the single easiest win. Industry baseline varies sharply by org size:
- 10K+ employees: 87% adoption
- 1K–10K: 62% adoption
- 26–100 employees: 34% adoption
(JumpCloud Identity Landscape 2024)
If you’re at 12%, you know exactly where the low-hanging fruit is.
5. SSO Coverage %
What percentage of your applications sit behind a single sign-on provider (your IdP)? Most enterprises have sprawl: some apps on Okta, some on Active Directory, some with standalone credentials.
Capture the count of “critical apps behind SSO” vs. “total critical apps.” This becomes your integration backlog.
6. Privileged Access Count
How many standing admin accounts exist across your infrastructure? How many are documented? How many have owners?
Privilege escalation and lateral movement depend on this number. Lower is better. Documented is essential.
7. Lateral Movement Exposure
Can a compromised workstation reach your database server? Can it reach the Kubernetes cluster? Can it even see the payment processing network?
This is binary: “Yes, lateral movement is possible” or “No, network segmentation blocks it.” Most organizations fall into the “Yes” category at Day 0.
Industry Benchmarks: How You Stack Up
Here’s where you compare your baseline against industry peers:
| Metric | Industry Average | Top 25% | Source |
|---|---|---|---|
| MTTD | 158 days | <60 minutes | IBM Cost of a Data Breach 2025 |
| Total Breach Lifecycle | 241 days | 68–80 days (AI-heavy orgs) | IBM 2025 |
| Dwell Time | 7 days median | — | Verizon DBIR 2025 |
| Breach Cost (Global) | $4.44M | — | IBM 2025 |
| Breach Cost (US) | $10.22M | — | IBM 2025 |
| Cost if Detected <200 days | $3.87M | — | IBM 2025 |
| Cost if Detected >200 days | $5.01M | — | IBM 2025 |
| MFA Adoption (10K+ employees) | 87% | — | JumpCloud 2024 |
| MFA Adoption (26–100 employees) | 34% | — | JumpCloud 2024 |
| Containment Speed (Mature ZTA) | 40–50% faster | — | Forrester |
A single day of faster detection saves ~$6,000 per day on breach costs. Your MTTD baseline becomes a financial metric: “Moving from 158 days to 60 days is worth $588,000 in breach cost reduction alone.”
Using the CISA Maturity Model
The CISA framework gives you a structured way to measure and re-measure. Here’s how:
- Assign a lead (your Zero Trust architect or CISO) to self-assess all five pillars against the model.
- Score each at Traditional, Initial, Advanced, or Optimal. Be honest—assessments inflate if the incentive is to look good.
- Document the reasoning for each score (e.g., “Identity is Initial because we have SSO for 40% of apps, but no device health checks”).
- Repeat quarterly. By Day 90, you’ll see movement. By Day 180, you’ll have a trend.
What “Good” Looks Like: Day 0 vs. Day 90
Your Day 90 target doesn’t have to be “all five pillars advanced.” That’s unrealistic. Be honest about scope. Here’s a realistic 90-day delta:
| Metric | Day 0 | Day 90 Target |
|---|---|---|
| Identity (CISA) | Traditional | Advanced |
| Devices (CISA) | Traditional | Initial |
| Networks (CISA) | Traditional | Initial |
| MFA Adoption | Whatever % | 100% on Tier 1 apps |
| SSO Coverage | Scattered | Top 10+ apps consolidated |
| MTTD (identity incidents) | “We’d never know” | Within hours |
| Privileged Accounts | Unmapped | Inventoried with owners |
This is ambitious but achievable. It shows board-ready progress without overcommitting.
Key Takeaways
Capture your baseline before Day 1. The metrics you lock in today become your scorecard for investment justification at Day 30, 60, and 90. Honest baselines (even if they’re embarrassing) give you credibility and a clear roadmap.
Compare yourself to industry benchmarks. Use MTTD, dwell time, and breach cost data to translate security into business language. A 2-day improvement in detection time isn’t just a security win—it’s $12,000 in breach cost mitigation.
Focus on scope, not perfection. Move 2–3 CISA pillars one level in 90 days. Document the rest and schedule it for Phase 2.
Up Next
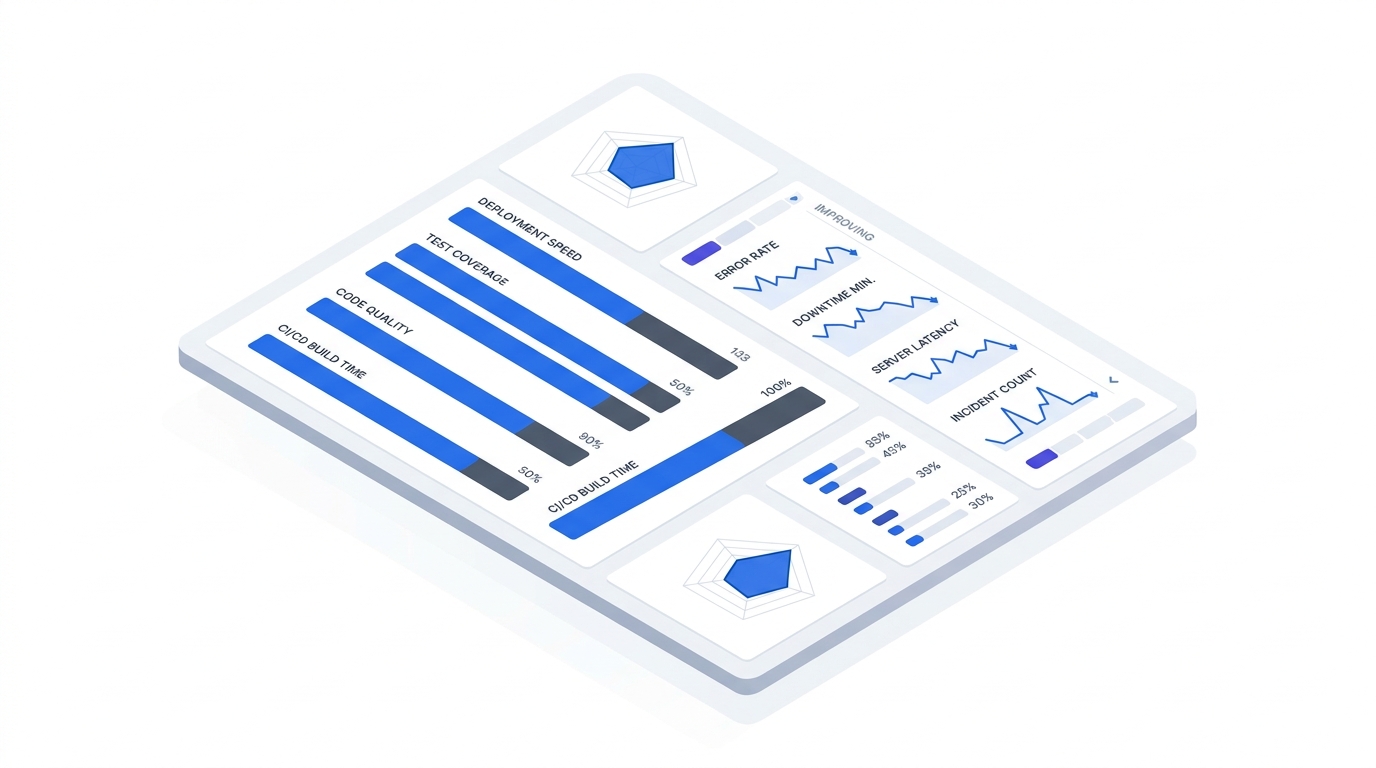
Your baseline metrics feed directly into the 90-Day Playbook, where you’ll define the initiatives that move the needle. You’ll also reference these numbers when you present to the board at Day 90—link forward to the Measurement Dashboard to show the full financial impact.
For context on why these numbers matter to the business, see the Business Case for Zero Trust.
Related Articles in This Track
- Application Criticality Scorecard — Prioritize which apps get Zero Trust controls first
- Governance Structure — Who owns these metrics, and who reports them?
- 90-Day Playbook — The full roadmap to move your baselines in 90 days
- Measurement Dashboard — How to track and report progress