Network Baselining: What You'll Discover (and Why It Matters)
Published
Ask your IT team how many SaaS applications employees use. They’ll say 30, maybe 40. Microsoft’s Defender for Cloud Apps telemetry routinely finds over 1,000 in organizations that answer “40” — a 25–30x reality gap. Before you design a single micro-segmentation policy, you need to close that gap.
This is Phase 2, Chapter 2 of the 90-Day Zero Trust Playbook. Phase 1 hardened identity. Phase 2 is about visibility: what is actually running on your network, what talks to what, and which of those flows you had no idea existed. Skip this step and your Phase 3 enforcement will either block legitimate traffic or leave the real attack paths open — often both.
Key Takeaways
- IT typically estimates 30–40 cloud apps in use; actual counts routinely exceed 1,000 (Microsoft Defender for Cloud Apps)
- Roughly 80% of employees admit using unsanctioned SaaS, and about 50% of cloud app purchases are made by individuals, not IT
- Accurate east-west traffic patterns require 21–30 days of continuous flow capture; full maturation takes 3–6 months
- Service mesh telemetry (Istio, Linkerd) gives you per-request identity-aware baselines that NetFlow cannot — Linkerd runs with 40–400% lower latency and ~30% less memory than Istio in benchmark tests
- The baseline you capture here becomes your micro-segmentation policy blueprint in Chapter P6
Why Baselining Is Not Optional
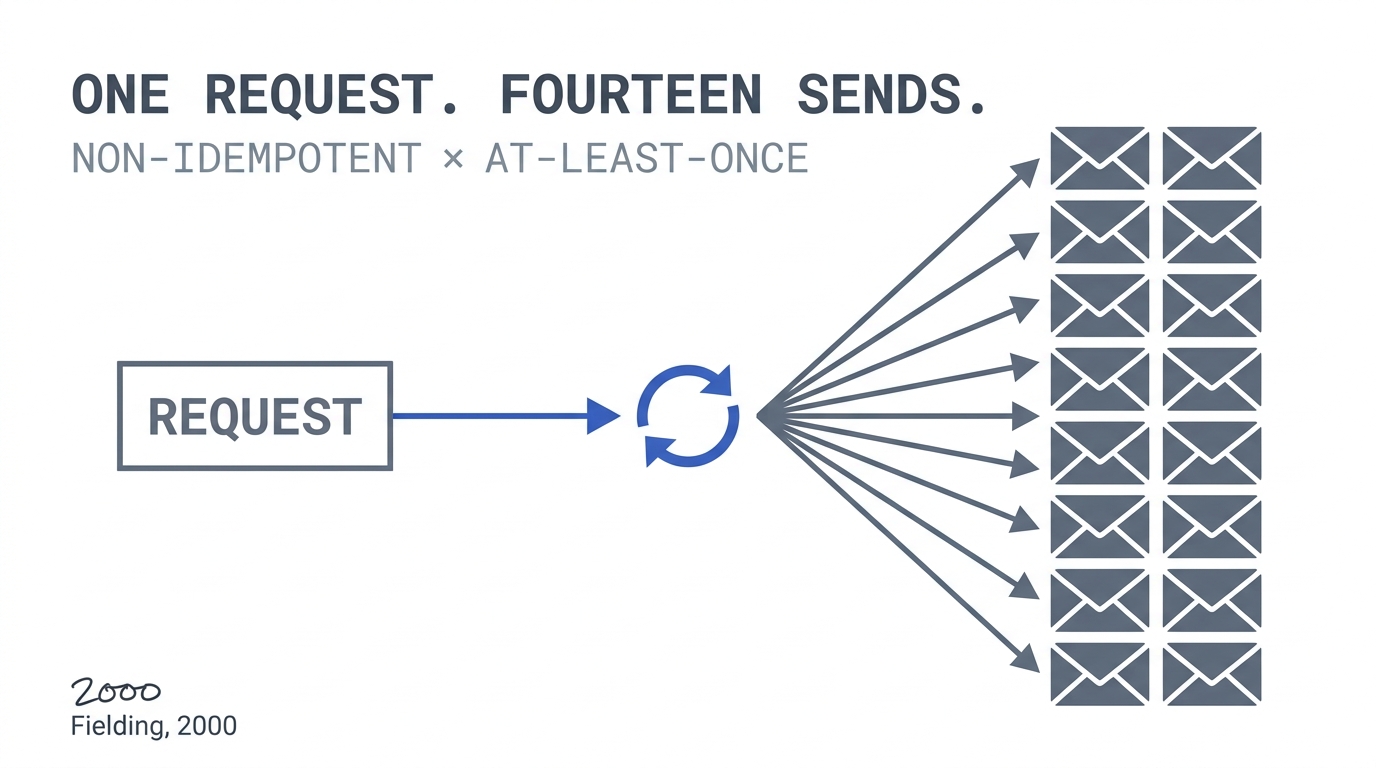
Zero Trust segmentation is the opposite of a default-allow network: every flow must be explicitly justified. But you cannot justify flows you’ve never seen. If you write policy from architecture diagrams instead of observed traffic, you will write fiction — and fiction breaks production.
Every brownfield baseline project turns up three categories of traffic the team didn’t know about: (1) legitimate dependencies nobody documented (the invoicing service quietly calling a 2016 reporting database), (2) shadow IT that users provisioned outside sanctioned channels, and (3) compromise indicators that have been hiding in normal-looking flows for months. You cannot tell these apart without data.
The Shadow IT Gap You’re About to Discover
Microsoft’s guidance puts typical enterprise SaaS usage above 1,000 apps — against an IT estimate of 30–40. Nudge Security’s analysis finds about half of cloud app purchases happen outside IT, with another third at the departmental level. Only ~15% flow through central IT procurement.
The risk profile compounds: these apps hold corporate data, authenticate with personal accounts or weak SSO, and sit outside DLP and conditional access. They will not show up in your CMDB. They will show up in your egress traffic.
Tooling for this pass: Microsoft Defender for Cloud Apps (catalog of 31,000+ apps, discovers from firewall/proxy logs), Netskope or Zscaler CASB, and open-source tools like OpenAppSec for teams without a cloud security platform. Point them at 30–60 days of proxy logs and expect a shock.
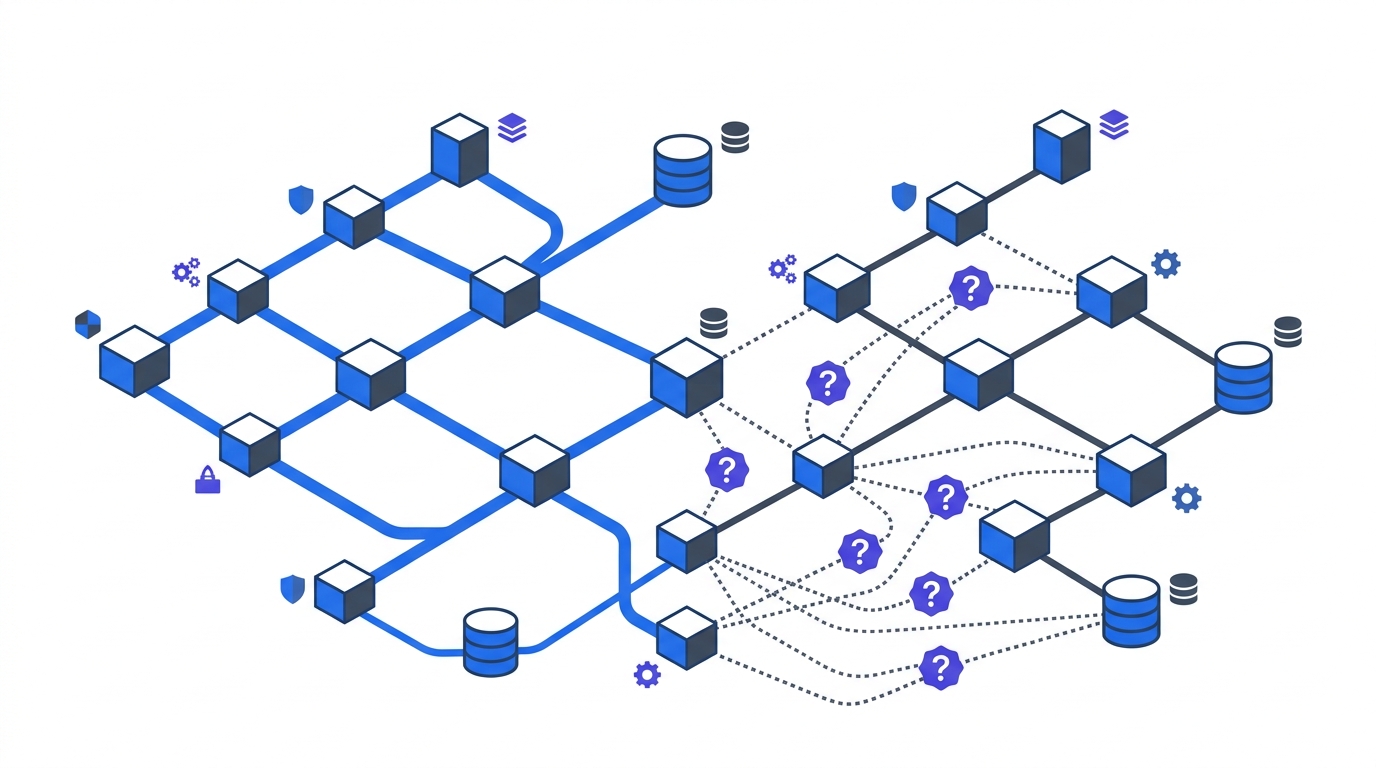
East-West Traffic: The Real Target of Baselining
Shadow IT maps what leaves your network. Micro-segmentation lives in what moves inside it — east-west traffic between services, databases, and workloads. This is where baselining gets hard and where it pays off.
Three data sources cover different layers:
- NetFlow / sFlow / IPFIX for physical and VM networks. Cheap, ubiquitous, protocol-level. Blind to encrypted payload and to in-cluster container traffic.
- Cloud VPC Flow Logs (AWS, GCP, Azure NSG flow logs) for IaaS. Captures VPC-internal flows including those routed over private links. Essential for multi-account AWS and multi-VNet Azure estates.
- Service mesh telemetry (Istio, Linkerd, Cilium Hubble) for Kubernetes. Gives you per-request identity — which ServiceAccount called which endpoint with which mTLS identity — not just IP:port. This is the only source that produces policy-ready data without a translation step.
A typical brownfield baseline runs all three in parallel and reconciles them in a graph database or observability platform. Service mesh adoption pays off disproportionately here — benchmark comparisons show Linkerd at 40–400% lower latency than Istio with roughly 30% less memory and 25% less CPU, making it a pragmatic choice when you want telemetry without taking a performance hit on the critical path.
How Long Before the Baseline Is Real
Baselining is time-series discovery, not a snapshot. Network observability practice converges on a three-stage timeline:
- Weeks 1–4: Data collection. Instrumentation goes live. Early data is noisy — you’ll see bootstrap traffic, deployment churn, incident spikes. Do not draw conclusions yet.
- Weeks 4–8: Pattern stabilization. Diurnal, weekly, and business-cycle patterns emerge. Month-end batch jobs show up. You can now distinguish “normal” from “anomalous” for most T0/T1 applications.
- Months 3–6: Full maturation. Quarterly patterns (finance close, peak retail, exam windows in EdTech) become visible. The baseline is now policy-ready for edge cases.
For the 90-day playbook, aim for Phase 2 exit at the end of pattern stabilization for T0/T1 apps. Phase 3 enforcement uses this baseline; full maturation continues into Year Two.
The Surprise Dependency Protocol
Every baseline surfaces flows nobody can explain. A disciplined team handles each one the same way. For every unexpected flow, document four fields:
- Source — which workload/identity initiated the flow
- Destination — which service/resource received it
- Purpose — what business function it serves (if any)
- Owner — the team accountable for keeping it or killing it
Then classify: legitimate (document, add to allow-list), unnecessary (retire before segmentation), or unknown (investigate — this is where compromises hide). Track the unknown queue weekly at your PMO. A healthy Phase 2 exit has the unknown bucket drained to near zero for T0/T1 systems.
What You Hand to Phase 3
By the end of this chapter, you should have:
- A discovered inventory of every T0/T1 application and the flows it participates in
- A 7-day rolling flow baseline with weekly and monthly pattern overlays
- A shadow IT discovery report with owner assignments for each app over a sanctioning threshold
- An application dependency map — the document that becomes your micro-segmentation policy blueprint in Chapter P6: Micro-Segmentation Design
This is the unglamorous middle of the playbook. Nobody gets promoted for producing a flow map. But every programme that ships Phase 3 on time ships it because this work was done honestly — and every programme that slips, slips here.
Next in Phase 2: device trust and BYOD policy. Return to the 90-Day Playbook hub for the full Phase 2 sequence.